How can we support researchers to navigate an evolving research landscape?
1. Grants are getting fewer in number.
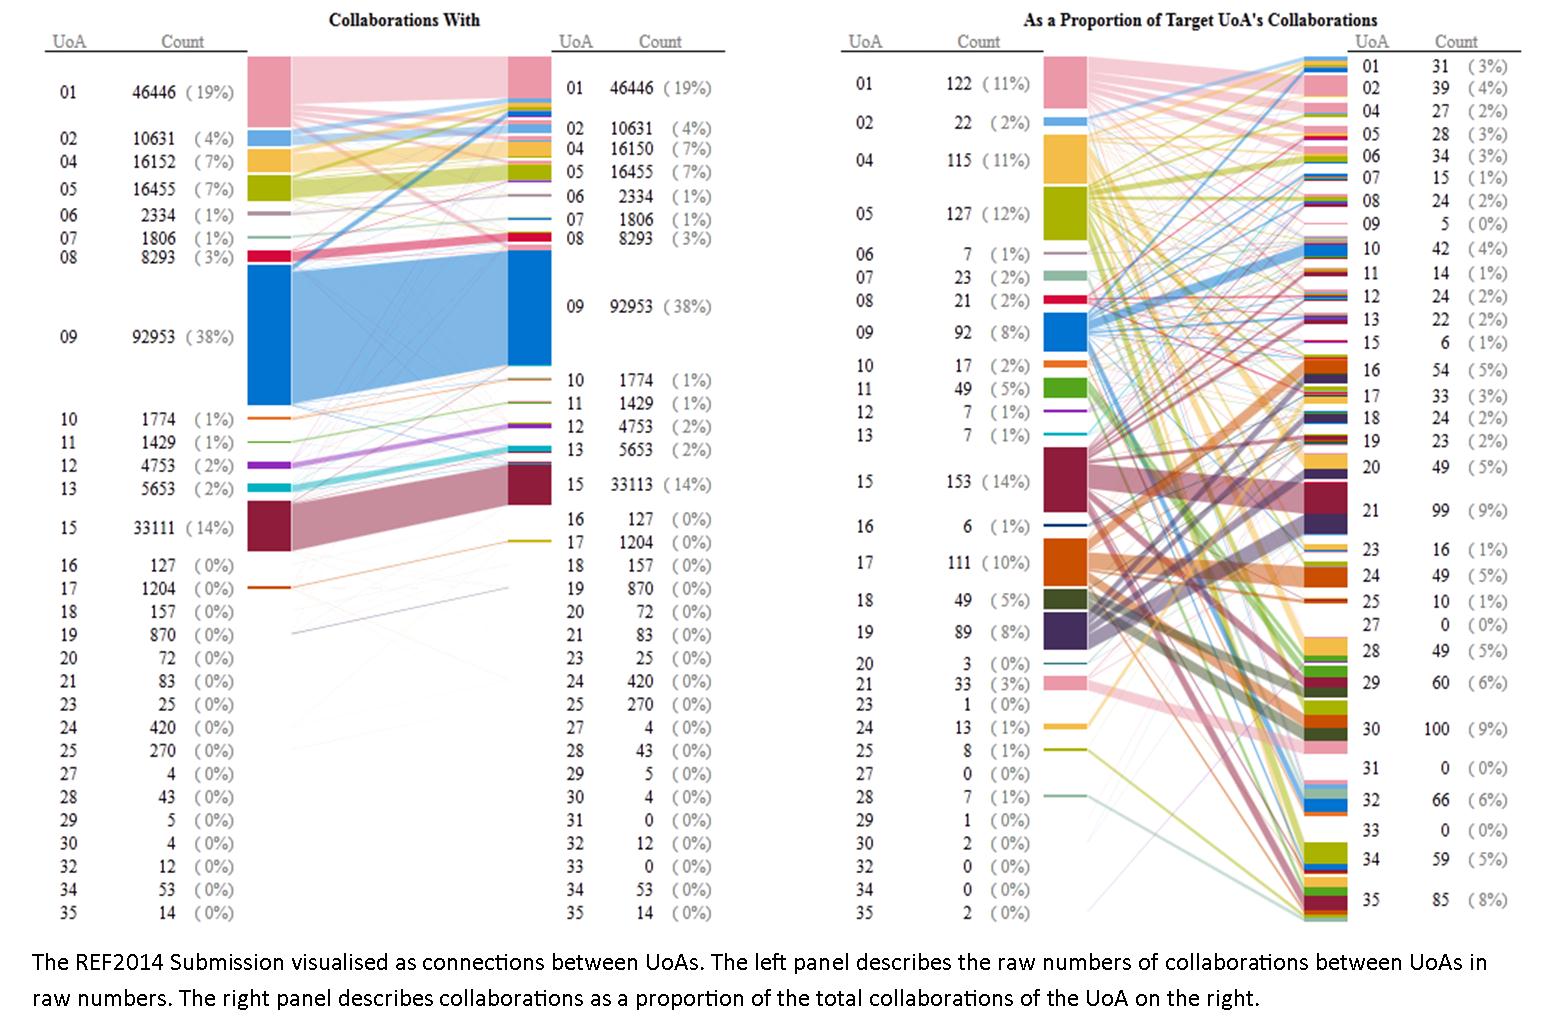
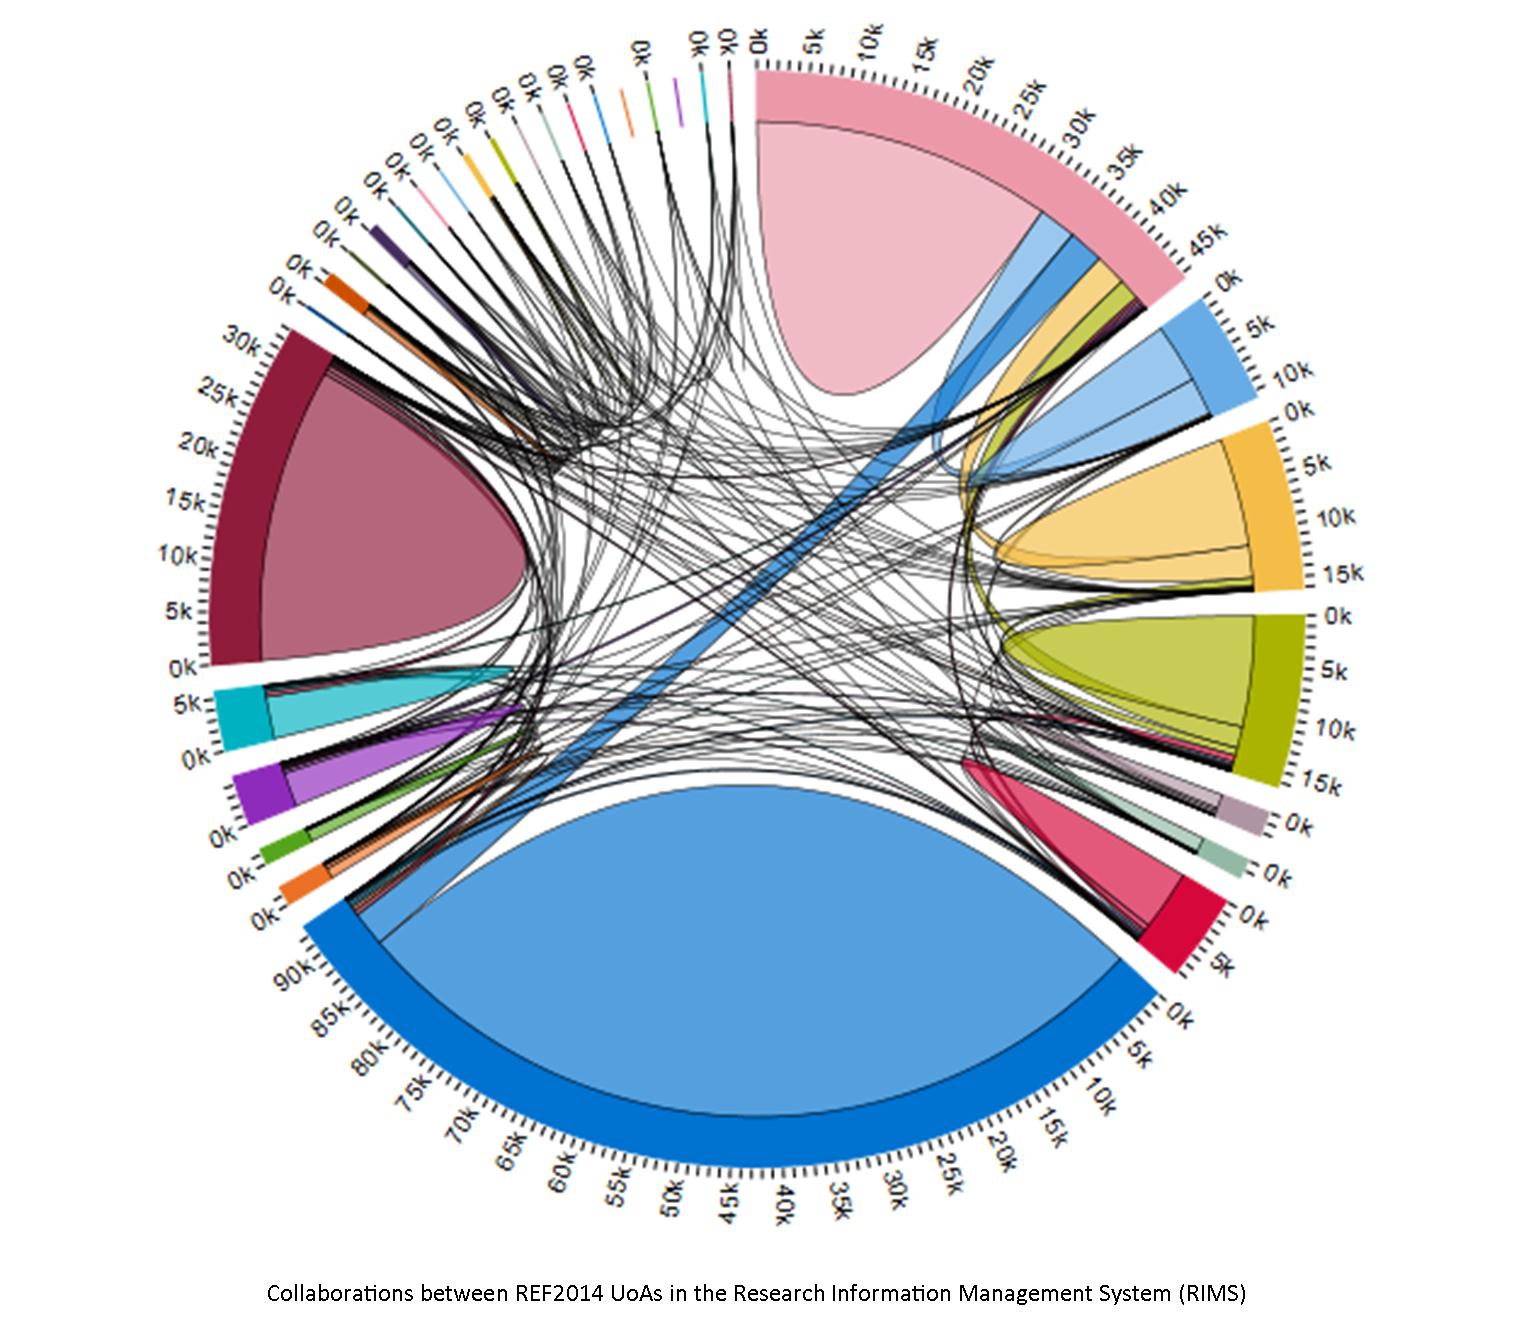
2. Research collaborations are becoming increasingly important in securing funding.
The composition of the REF2014 submission indicates that interdisciplinary research already forms a key constituent of research practice at the university.
Network analysis offers an opportunity to use data characterised by competing priorities and complexity, and mould it into something that is useful for the researcher, rather than simply another obligation.
Network Analysis is a toolbox of techniques that deals well with data that is characterised by complexity and co-dependence.
· Network Analysis is concerned with connectivity.
· Network Analysis can be visual or metrical (or both)
Which Researchers Share Interests or Approaches?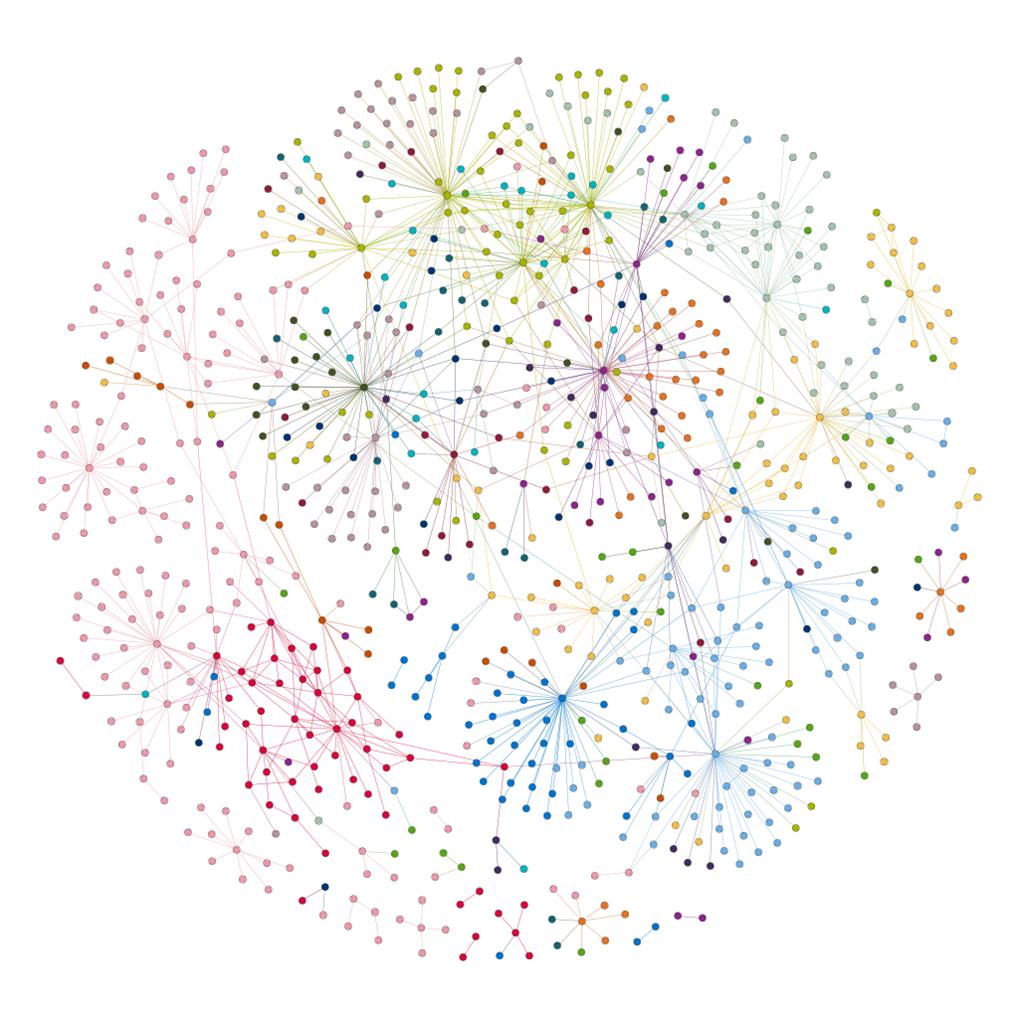
A network diagram of publications from the Research Information Management Systems for one of our Strategic Research Initiatives.
- Colours indicate University departments
- Points or nodes represent researchers.
- Connections or edges represent an instance of co-authorship.
When combined with contextual knowledge from our research support staff with specialist area knowledge, we can use this type of knowledge to:
- Provide introductions to people with similar interests.
- Model which topics lend themselves to extensive or intensive groups.
- Identify individuals who may be ready to collaborate on a bid.
Those researchers who have yet to author a paper together, and yet exhibit many of the same traits, can be matched with each other.
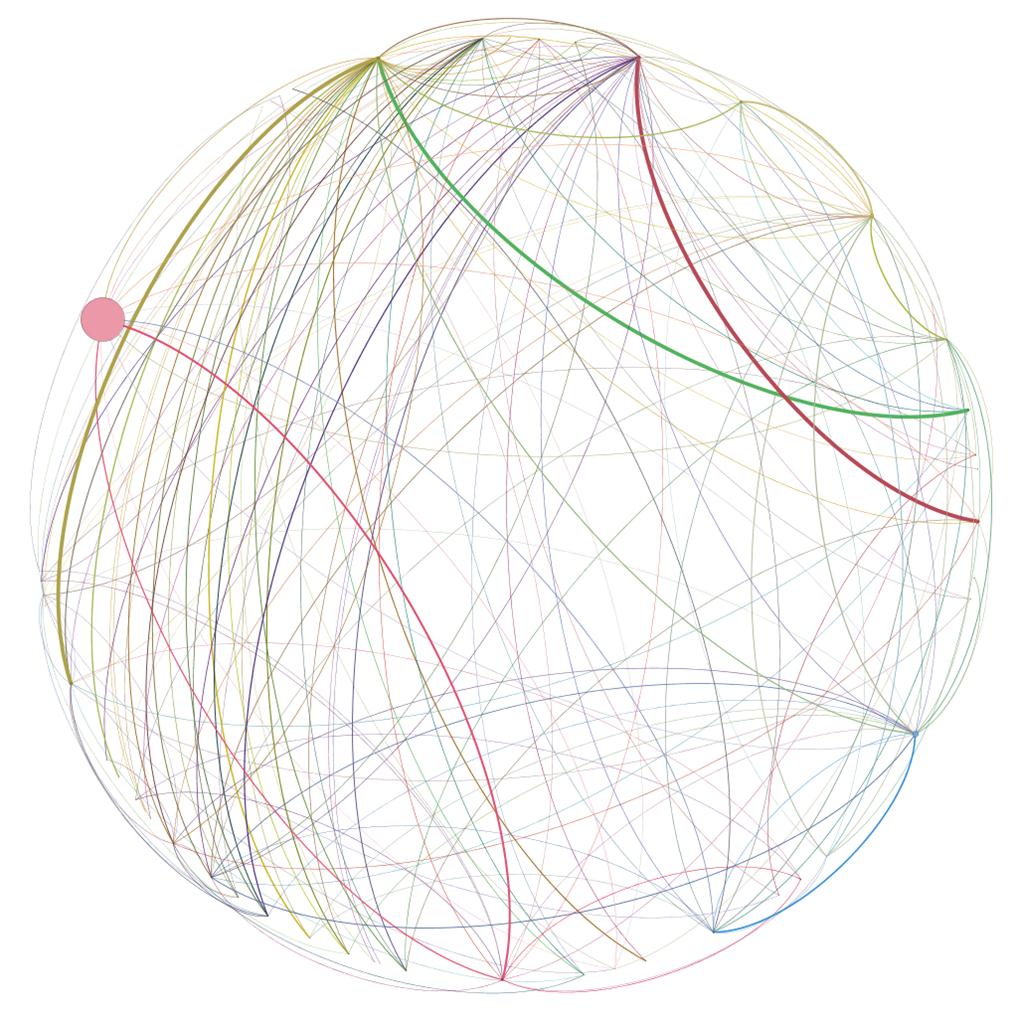
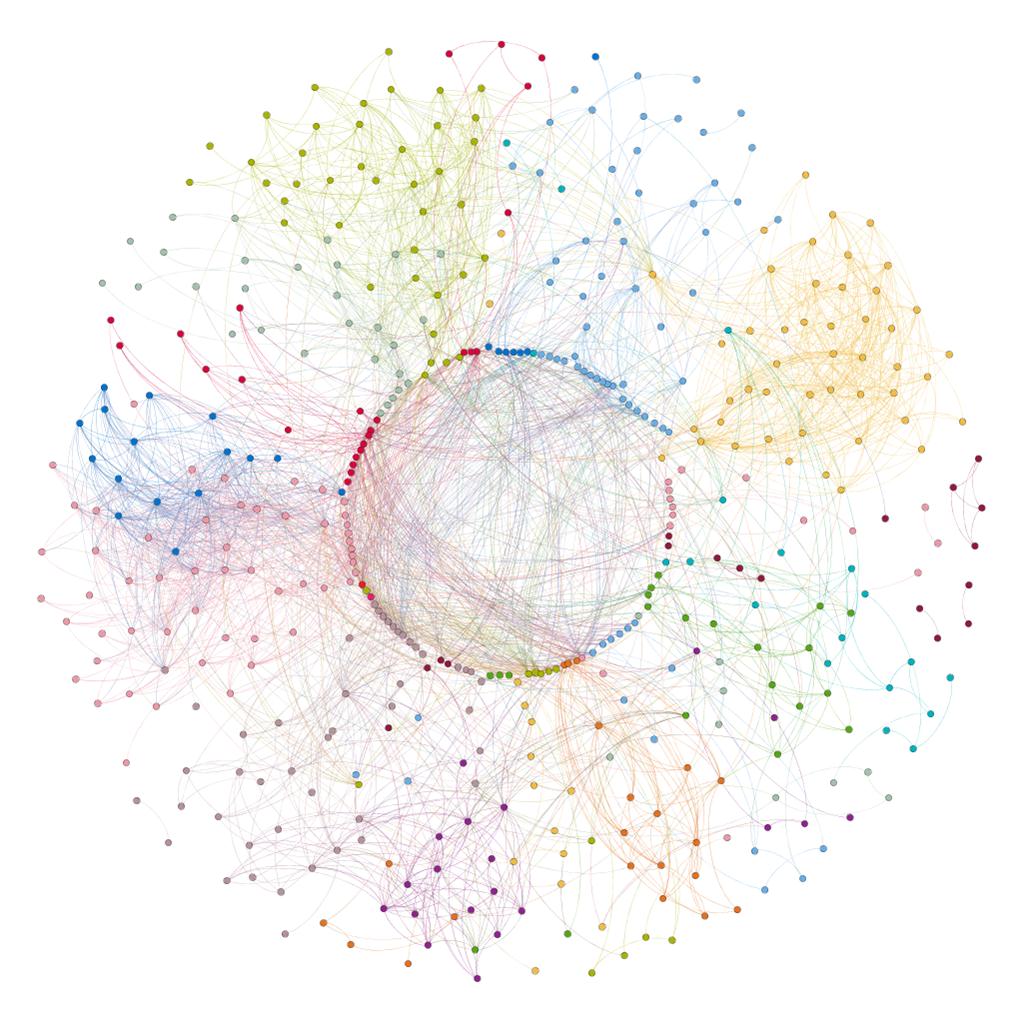
The same data re-organised to impose the University’s departmental structure. Departments are collapsed to one node, and edges link to other departments with which a collaboration has taken place.
Superimposing the departmental structure on to the data indicates the extent to which:
- Departmental boundaries have broken down.
- Conceptual spaces are delineated by interest, not by subject
Connections span across the entire graph, indicating that a substantial number of researchers’ collaborations are manifesting across departments.
The same data can be reorganised using clustering algorithms. Algorithms can be used to assign nodes to groups based on their behaviours and allows clusters to form around those nodes that are more inward facing in their final set than outward facing. N.B. The diagrammatic representation of clustering is meant as an heurisitc as it works on a mathematical operation rather than a spatial one.
Allowing the data to self-organise using clustering algorithms lets us identify those researchers who have common interests, or operate in a similar conceptual space without consideration of disciplinary boundaries.
· Clusters emerge from the data
This analysis can also identify nascent groups that have yet to achieve recognition, from the centre, allowing us to focus support on their needs.
Extending Analysis Beyond Collaboration
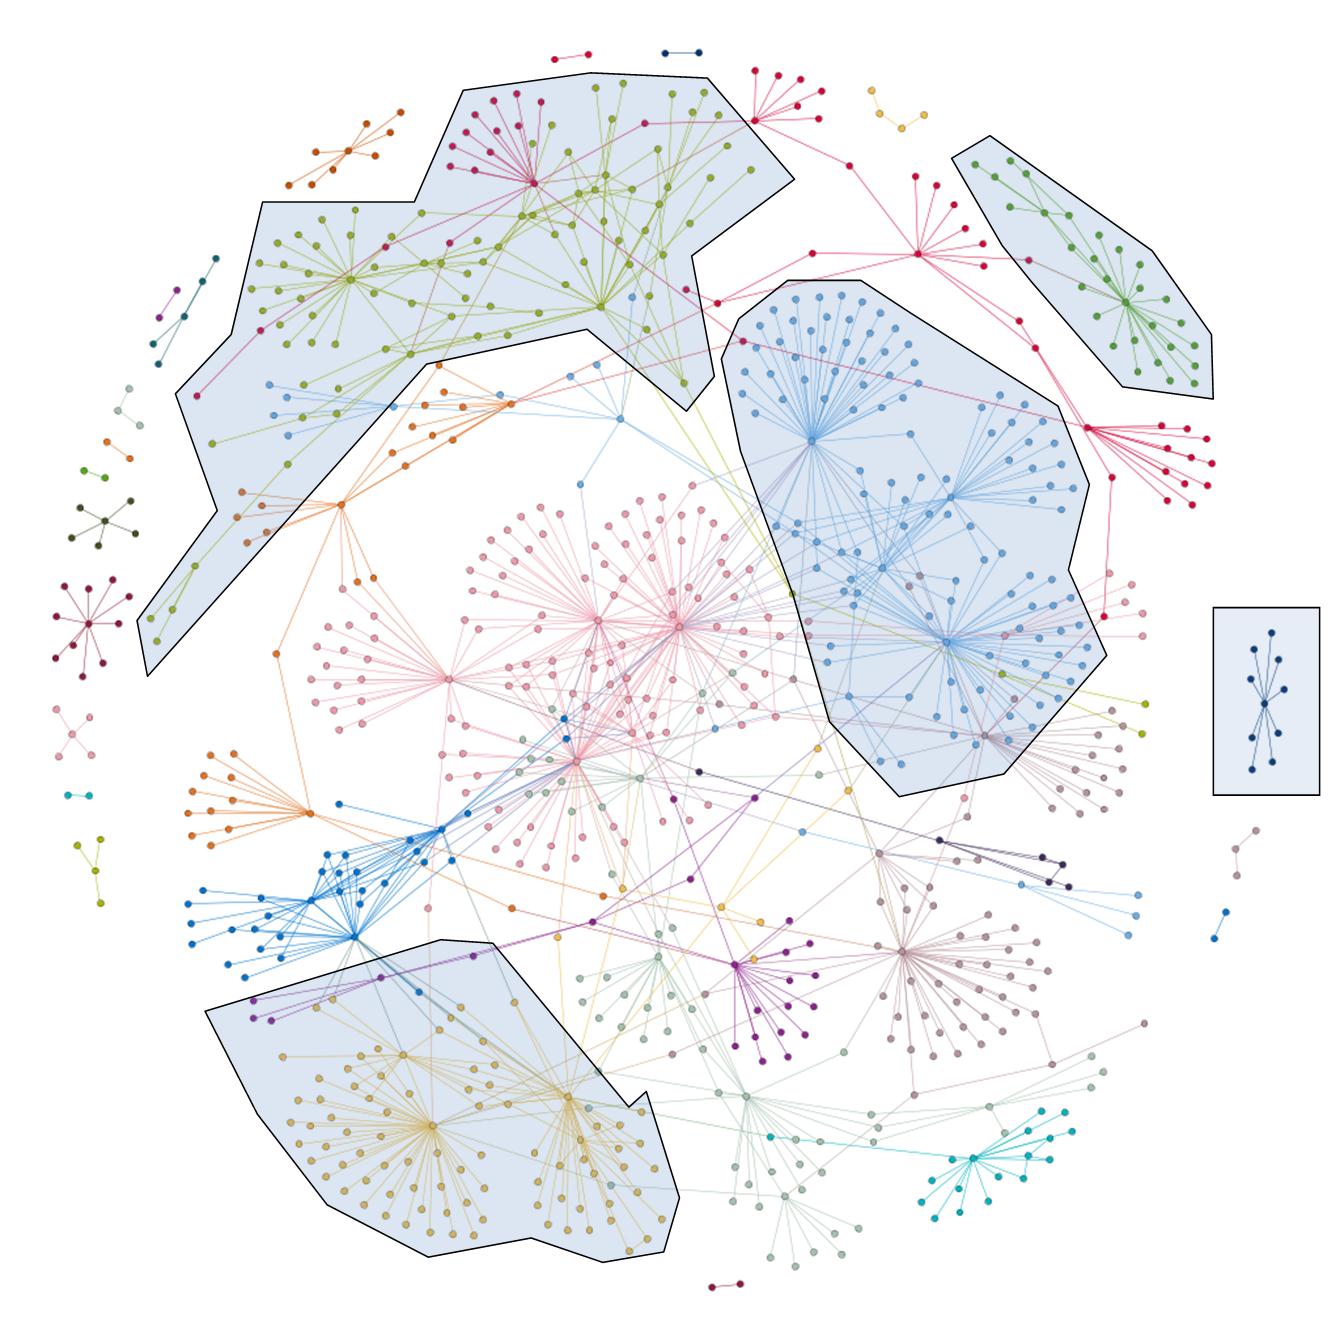
Using “collaboration” as a linking factor is of limited use in contexts where expected disciplinary practise does not naturally result in explicit collaborations, such as the Arts and Humanities.
Because of the more fragmented publishing environment in areas like the Arts and Humanities, specialisms manifest in the publishing destinations chosen by each of the researchers.
- By choosing the optimum publication destination for their work, researchers indicate the subfields to which they are contributing.
- Researchers from disparate fields publish alongside one another in journals with a high degree of specialism.
- Frequently these researchers can be unaware of each other.
Analysing the intergroup edges and the extent to which individuals are inward or outward facing has allowed us to:
- expand research groups,
- find speakers for seminar series,
- help PIs to find collaborators,
- help to find co-supervisors for ECRs and Doctoral Students.
Intergroup edges in the Arts, Humanities and Social Sciences.
Nodes and links coloured by home department.
Outcomes
Network analysis has provided valuable support to interdisciplinary research groups and researchers:
- helping to get pump-priming funding bids to application stage;
- identifying researchers peripheral to the core, and integrate them with the activities and goals of the initiatives;
- finding nascent research groups and allowed research support staff to pre-empt and prompt funding bids between groups
Conclusions
i. Data reporting exercises provide a valuable opportunity for institutions to gain self-knowledge,
and are much more powerful than a basic bench-marking tool.
WE SHOULD TAKE ADVANTAGE OF THE DATA WE ARE OBLIGED TO PROVIDE.
ii. It is both rewarding and interesting to move away from measurement and towards understanding.
Network analysis allows research support to gain insight into the needs of their researchers.
INSIGHT IS MORE USEFUL THAN MEASUREMENT.
Content from a poster presented at the ARMA Conference 2015 by Dr Owen Roberson and Dr Jürgen Wastl, Research Strategy Office, University of Cambridge
Graphics constructed using the D3.js library and Gephi