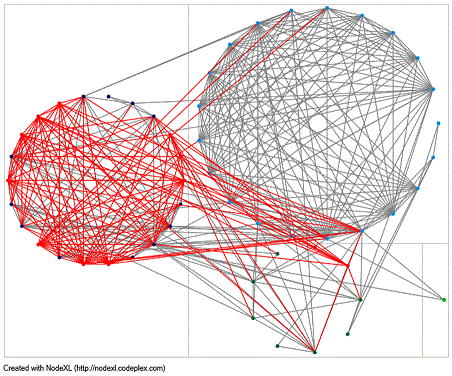
 Using data accumulated in Symplectic it is possible to generate network graphs to visualise the interconnections between researchers at Cambridge. Trends in research and its dissemination can be mapped using any element which forms a link, such as co-authorship, research topic or even specific journals or method of publication.
From this it is possible to understand some of the ways in which members of a particular group, such as a department or Initative or Network, interact in a given context and identify key individuals who may variously act as ‘gate-keepers’ who maintain paths between people or groups; ‘pulse-takers’ who have particularly useful connections; or ‘information hubs’ with large numbers of a particular type of connection.
Degrees of separation?
It is also possible to explore the connections between members of a defined group and consider not only the direct connections between them (through collaboration or publication), but who their collaborators collaborate with, and what other connections they may have made.
As well as being interesting in itself, and useful when reporting on the reach and scope of a particular project, such analysis may suggest trends in publication profiles or previously unknown areas of common interest and new opportunties for partnership or strategies for research dissemination.
Click here to read more about how we use network analysis at Cambridge, or to see a graph of the collaborations at Cambridge click here.
To find out more please contact researchinformation@admin.cam.ac.uk
